Introduction
The latest canvasses reminded me that I completely forgot to blog about my own canvas! I tried to create a little guide/cheat sheet that could support you during your first experiments with Software Analytics: The “Software Analytics Canvas”.
Software Analytics Canvas step by step
The Software Analytics Canvas is a step-by-step guide for your particular software analysis.
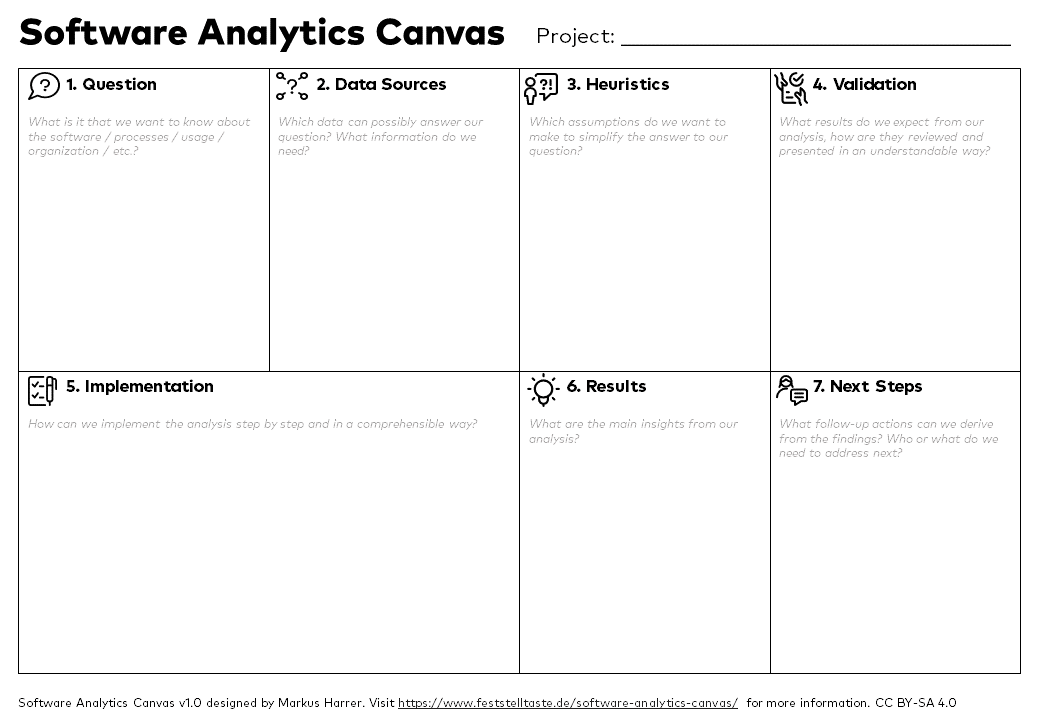
The “Software Analytics Canvas” (PDF version)
It incorporates the steps that I implicitly repeated for several software analysis tasks in various environments. You don’t need to follow this stepwise approach. It should more or less challenge your idea for data-driven software analysis. Let’s go through each step!
Step 1: Question
What is it that we want to know about the software / processes / usage / organization / etc.?
Every decent analysis starts with a good/interesting/relevant question. So in the first section, you can state your very specific question. What do you intend to analyze? Is it a question about a real problem? Or are you talking only about a symptom? Also: Who cares about the issue and will listen to your (probably unpleasant) answers? And most importantly: If you have the result, what would it change based on the new insights?
Step 2: Data Sources
Which data can possibly answer our question? What information do we need?
There are plenty of data sources out there that might be relevant for your analysis. Which data sources do you have at hand? Which kind of information can they provide? Is there data missing for your analysis task? Do you need to setup some manual data collection tasks in your team?
Making your choice of data is very important from the start on to avoid false conclusions later on. If you need to extract some data from a system, clarify how you did this data export.
Step 3: Heuristics
Which assumptions do we want to make to simplify the answer to our question?
Not all data that comes from existing systems is a good candidate for software analysis. Nor can we expect to have data that can answer our very question precisely. What we need are approximations based on the data we have. Make it open what you see within the data and document your simplifications about the data points.
Step 4: Validation
What results do we expect from our analysis, how are they reviewed and presented in an understandable way?
One key to making a difference with software data analysis is that we present the results comprehensively and understandable for people that make decisions and/or have the money. How can these requirements be met? But it is also open when we know that we have found an answer to our question. What is it that we want to work towards to get to the bottom of the analyzed problem?
Step 5: Implementation
How can we implement the analysis step by step and in a comprehensible way?
Now it’s the time to get the hands dirty. But first, its better to think a minute or two about a possible and smooth implementation of the analysis. If the analysis’s program code gets too complicated, nobody will understand it and doubts regarding your results could be emerging. Sketch the rough implementation ideas and tools that you consider to use to avoid getting lost in the analysis code.
Step 6: Results
What are the main insights from our analysis?
Here you can list the key point that you have found out with your analysis. What were the actionable insights you got?
If there were none, document them anyway. Or did the analysis not work as expected? Are the results standing on a too shaky a floor? Never mind! You got more experience in data analysis in the software area. Next time you can do it differently!
Step 7: Next Steps
What follow-up actions can we derive from the findings? Who or what do we need to address next?
A software analytics task is not complete if it does not lead to concrete next steps that improve the current situation. Which decisions can now support the results of the analysis or lead them ad absurdum? What are possible experiments that can be carried out based on the facts that are available now? Make an obligatory todo list or write down ideas for further analyses to investigate a newly found insight more deeply.
Bonus
If you filled out this Software Analytics Canvas for your data analysis of software systems, you also get a kind of documentation of your analysis for free! With this, you can share your experience with others or later access investigations that have already been done. So you don’t have to keep reinventing the wheel next time.
Credits
This work was also inspired by this paper from Choma, Joelma & Guerra, Eduardo & Silva, Tiago & Zaina, Luciana & Correia, Filipe. (2019). Towards an artifact to support agile teams in software analytics activities. 88-93. 10.18293/SEKE2019-146.
Acknowledgement
Parts of this work were created for my Software Analytics (remote) workshops, which I run at INNOQ. Thanks for this support!