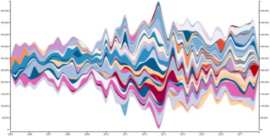
In this blog post, I want to show you how you can visualize the contributions of developers to your code base over time. I came across the Stream Graph visualization and it looks like it would fit quite nicely for this purpose…
Visualize Developer Contributions with Stream Graphs

![Session Summary [DevOps Camp compact 2017] Session Summary [DevOps Camp compact 2017]](https://www.feststelltaste.de/wp-content/uploads/2017/10/game_over.jpg)


