Introduction
When you come across my blog, you may be thinking “What is this guy doing”? There are some weird analyses that have somehow to do with software development. But why all this?
In this blog post, I’ll show you why and how I’m doing all this and what you can do as well. The content (and pictures) consists almost of all the things I’m talking about at meetups and conferences (see here for the original slides).
So let’s dive into the fantastic world of “Data Analysis in Software Development”!
Motivation
OK, why should we care about data analysis in software development?

When management looks at a software system, it sees its user interface with fancy colors, all the shiny things to click on and so on.
So why shouldn’t management assume that under the hood of the software, everything is fancy and shiny, too? The software looks good! OK, the schedule is always tight, but as management likes to say: diamonds are made under pressure, right?
So from the management’s perspective, everything is fine. Software developers must be the happiest species on earth. But why are they nagging from time to time and leaving the company, when everything is so super fine?

There is an easy test to find out if developers are really happy or not: Just meet them in a pub after work and listen to the conversations after a few beers. There you can see what kind of problems they are really talking about.
One developer might say something like:
“We have now a seven layer architecture!” We ask “How did that happen?” “Every year, we create a new layer to cover the crap from the last year!”
What I’m observing here as the real problem is that we developers are masters in symptom fixing. If there is something awkward in the code, we fix it immediately. But sometimes, we fail to see the big picture and are missing to find out the real root cause of the problems which leads to weird situations in the software.
Another conversation could go on like this:
“Our flagship software system crashed yesterday in production.” We ask: “What did happen?” “Nothing! Nobody uses it!”
I see that sometimes someone sold something to management that’s absolutely not what is really needed in reality. Because of missing feedback from the real world, this often leads to huge buildings in the sky (or clouds) that have absolutely nothing to do with what is needed – causing just a massive amount of money without any effect on the revenue stream.
 So, if we take a look at the complete picture, there isn’t everything fine in software development. The pressure that is affecting developers doesn’t produce diamonds. Pressure on developers, unfortunately, result in a decrease of the internal quality of the software – a thing invisible to management – which leads to the famous brownfield or legacy systems every one of us knows.
So the question is: Why is it that way?
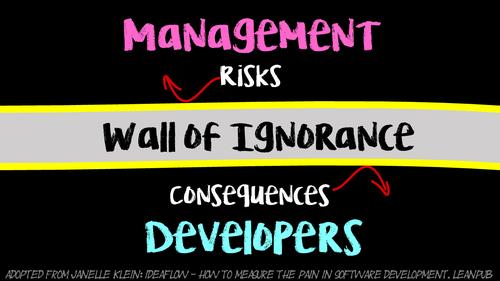
What we are really facing here is not only the different views on software between management and developers. The real problem is the so-called “wall of ignorance” which is invisible to use developers as well as management.
The wall of ignorance ensures on one side, that management cannot get feedback of the consequences of risk-taking (like tight schedules or no budgets for refactorings) – which could lead to bad surprises after a few years of development when the software system became suddenly unmaintainable. On the other side, developers don’t have the means to communicate the problems that are bothering them in their daily work. In complex software systems, there are thousands of awkward things waiting to be fixed along the business’ strategies and their risks.
So on the bottom line, it’s not possible (until yet) to develop software hand in hand, creating software systems that appreciate risk-taking to get quickly into a new market or creating sustainable software systems where the valuable parts of the software are of a good internal quality as well.
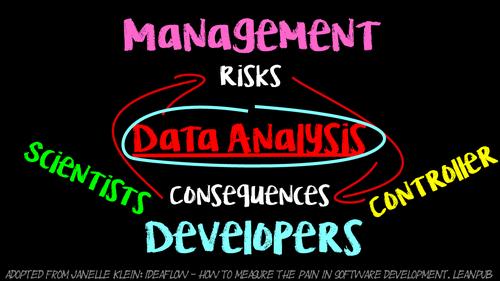
Can we get out of this situation? I deeply believe yes! We as developers can use data analysis to get rid of the wall of ignorance aka missing feedback loop. Taking other disciplines as an example like controlling – which delivers feedback and guidance in the area of risk-taking – or scientists – who make the invisible visible and the complex understandable – we as developers can use data analysis to make risks as well as consequences more visible to management and the other way around.
Data Analysis in Software Development
How can we do that in software development as well?

There is a discipline with huge contributions to data analysis in software development: empirical software engineering. The problem with empirical software engineering is, that it is very academic, theoretic and that researcher in this area often search for the Holy Grail – which, unfortunately, doesn’t exist, but that is another story. This makes empirical software engineering very intangible for practitioners like us. But we can use the experience and methods developed by those researchers to apply them on our individual problems.
For this, there is a sub-discipline in empirical software engineering that some researcher invented not too long ago. It is a more pragmatic, down to earth way of using data analysis in software development: Software Analytics
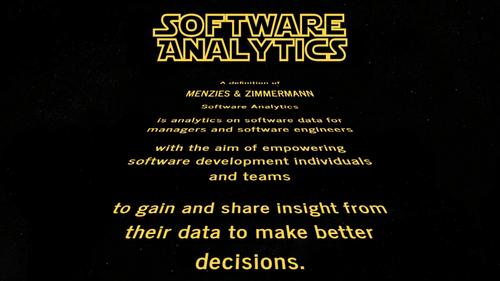
I found this nice definition of Software Analytics from two of the main contributors to the topic: Tim Menzies and Thomas Zimmermann. They say:
“Software Analytics is analytics on software data for managers and software engineers with the aim of empowering software development individuals and teams to gain and share insight from their data to make better decisions.”
This definition encouraged me to dive into the topic of “data analysis in software development”.
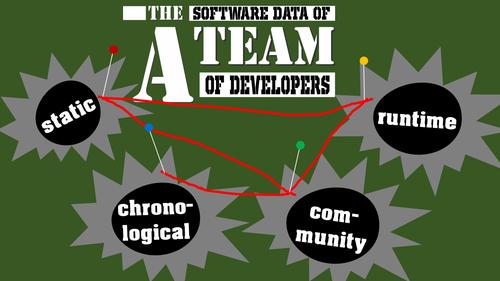
Of what kind of data are we talking about? Let’s look at the software data of a team of software developers:
- We have some static data like source code, specifications or documentation that we can analyze
- Runtime data like performance data, usage data or test results reports
- Chronological data like log files or data from version control systems
- Community data like open source projects including their tickets systems or build execution logs
Every data source is valuable on its own, but it’s getting really interesting when we are bringing these data sources together to get insights from more perspectives. We will see later on, how we can do that.
In the meantime, you might be asking yourself: data analysis on software data? Don’t we do that since the seventies? Yes, there are some famous metrics like lines of code, cyclomatic complexity, Halstead metric or static code analysis tools like FindBugs, JSLint as well as complete quality assurance tools like SonarQube. What makes Software Analytics different? Let’s compare these approaches.
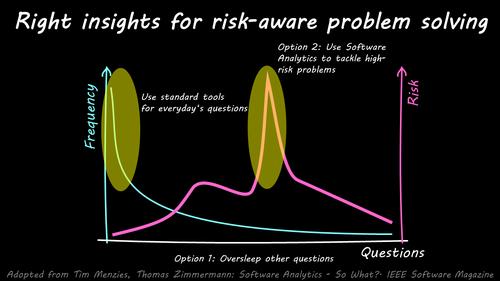
What we have here is the frequency of questions that are asked in software development. There are some questions that occur over and over again like “did I document my public API” or “will there be a null pointer in my application” but also questions that aren’t asked very often which are very specific things and very dependent on the software system you are developing.
The problem is that the frequency of a question doesn’t necessarily need to correlate with the risk of the question. It could happen that you are lulled into a false sense of security by only seeing and tackling the problems that your software quality dashboard are showing to you. Some questions on this side might be for example a severe problem that prevents you from going live or a performance issue that is waiting for you when your application will be used in a production environment. These rare questions with a possible high impact that aren’t shown in your standard quality dashboard. But the thing is, often developers know that something might be wrong. But a short sarcastic comment in a meeting or a gut feeling alone isn’t enough to get money for fixing this kind of problems.
So, we can react to this situation in two ways: We can either simply ignore the high-impact problems, running into the risk that we run blindfolded against the wall at full speed. Or we can use sexy Software Analytics to work out the specific risks that are lurking in our software systems, finding root causes and tackling severe problems. I find that we should do the later and use data analysis in software development.
Why do I think that this is possible today?
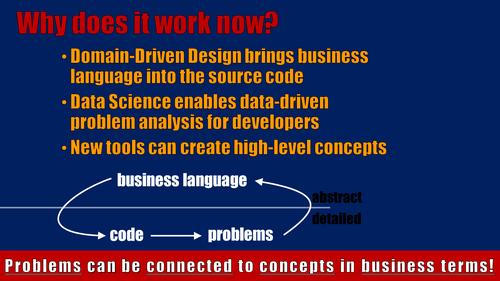
- First, thanks to Domain-Driven Design and other movements, more and more language of the business people are getting into our source code. Very fine shades of business terminology are needed in our programs to implement the more and more tricky requirements of the business.
- Second, thanks to current trends like Data Science, Big Data or Deep Learning, more and more software developers learn to create and use data analysis tools. I believe with just a little nudge, developers will understand that they can use those tools not only on business data but also on their own software data.
- And third, there are now tools out there that enable us to build higher-level concepts or abstractions upon otherwise very fine-granular, detailed measures or problems that we’ve spotted in our code base.
At the bottom line, that means “problems can be connected to concepts in business terms”. We are living at exciting times where we can now make our pain points visible to management by creating a business perspective on the problems. This not only enables developers to communicate consequences of risk-taking to management, but also management can get feedback from their decisions!
All right, let’s look at how we can make Software Analytics usable for us developers.
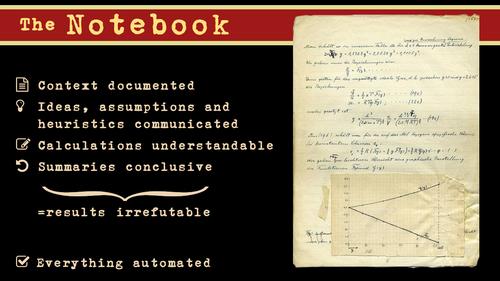
In my humble opinion, the key factor in doing this kind of data analysis in software development successfully and efficiently is by using a notebook-based approach. What is a notebook? What we see here is an excerpt of a notebook from Albert Einstein. The interesting thing for us here is how people like Albert Einstein structure their analysis. If we look at this analysis, we see that:
- the context of or the reason for this analysis is documented
- ideas, assumptions and heuristics are communicated
- calculations are understandable
- summaries conclusive and in this case supported by a nice little visualization.
So every step in the process is completely open – from the initial idea over the actual analysis to the result – which makes this kind of analysis irrefutable and it makes it also possible for other people to repeat the analysis.
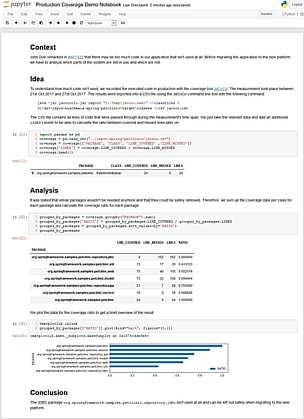
We can take the same concept and digitize it which leads to a fully automatable, open data analysis from the initial data to the end results. How does this look like in detail (see here for the full notebook)?
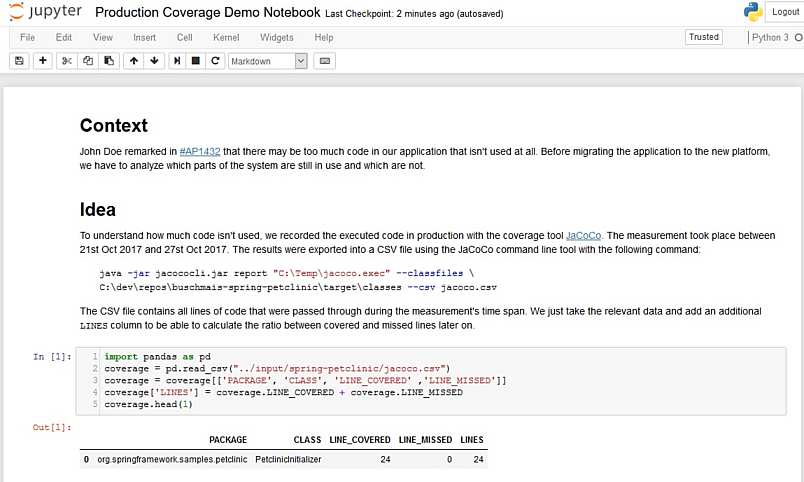
Here we have an analysis with the aim of strategic code deletion. We want to find out which parts of the software system are probably not needed anymore by analyzing real usage data.
We start the notebook with a nice heading followed by the context section. Here we describe where the initial need for the analysis comes from. In this case, someone uttered the feeling that we probably won’t need all the source code that we have right now.
Then the idea of a suitable analysis is sketched by describing which data we have at hand and how this data could be used for the analysis. We see here also the data import statements and the immediate result – allowing it to follow up each step of the analysis.
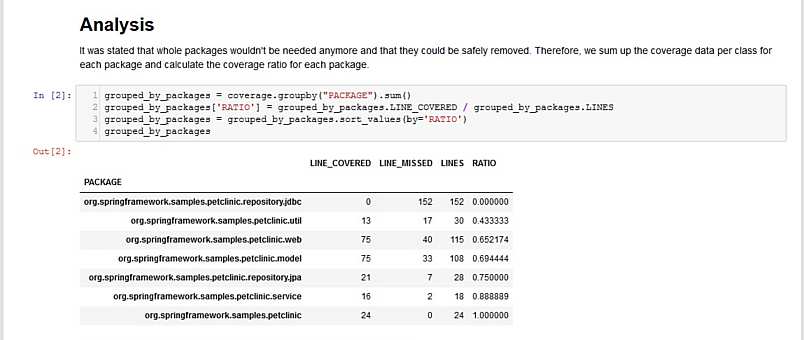
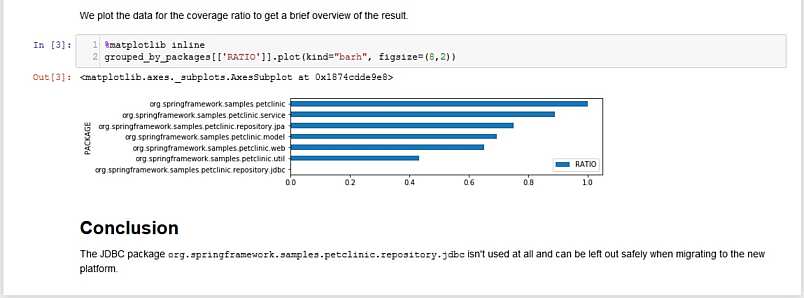
Then, the actual analysis part follows by implementing the idea with the data analysis framework. The immediate result is displayed directly afterward and a bar chart is created to visualize the result for management in a nice graphical way.
And, at last, the conclusion is written down – which is here that it’s totally save to delete a whole module without any side effects because there is now an alternative for this module and the former developers simply forgot to delete the old one.
Tooling
How is this implemented? Well, I’ve used a standard Data Science stack for this.
- The notebook that we’ve seen is implemented using the Jupyter notebook system which is kind of the central hub for the data analysis as well as the documentation.
- As programming language, I’m using Python, which is nowadays the data scientist’s best friend. It’s very easy to use but fast as well thanks to libraries that are written in the C programming language.
- The “workhorse” of the whole analysis is the data analysis framework pandas which offers great data structures for processing tabular and semi-structured data as well as very good integrations with other libraries. The core element of pandas is a so-called DataFrame, of which you can think of as a programmable excel sheet for huge data that can easily process gigabytes of data.
- And the visualization we’ve seen was produced via matplotlib, which is a library that can produce plots like bar charts or line charts in a programmable way.
With these tools, you can get pretty far regarding your first data analyses. Everything that is kind of tabular can be processed easily with this stack. You can also group data into something that makes sense to non-technical people by using the included business terms that may be in your data.
But what about the heavily interconnected data that we are facing in software development so often? And what about creating high-level abstractions upon our fine-granular data if you don’t have easy access to business terminology or architectural information?
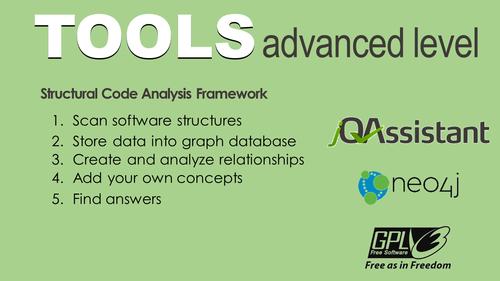
For these requirements, we can use some advanced tooling. Let’s dive into the graph-based analysis of software data with jQAssistant – the structural code analysis framework.
- jQAssistant scans software structures for various software sources like the bytecode of the Java programming language, the Git version control system data, test result reports or findings from other static code analyzers like FindBugs.
- It stores all the data into the graph database Neo4j – which is, by the way, the mostly used graph-database out there
- Then, jQAssistant creates new relationships between all the software structures and provides a means for analyzing those relationships
- You can then also add your own concepts – by which I mean things that you talk about when describing your software system – like your layers in the software, architecture and design patterns as well as your view onto the business domain.
- And at last, jQAssistant helps you to find answers to your specific questions, helping you to identify problems at large scale and communicating your findings in a language that non-technical people can understand hopefully.
How does graph-based data analysis work? Let’s have a look at the data that is getting scanned by jQAssistant and stored into the Neo4j database.
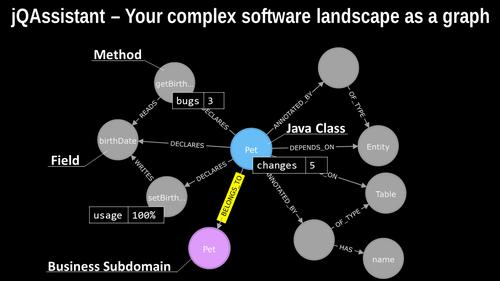
Here we have a tiny little part of a Java program. We see typical software elements that the Java programming language uses like fields, methods or classes. These are the nodes in the graph model. But we also see the relationship between these elements like that this class declares this method which reads this field. And from the relationship type to this node here, we can see that this method writes to this particular field. This view helps us to identify specific patterns in our software systems. For people who are familiar with the Java programming language, it’s easy to see that on the right hand side, the relationship between the Pet class via the annotation node to the Entity node on the far right means, that the Pet class is a Java Persistence API entity and by inspecting the relationship to the Table node we also see that the Pet class is also represented as a table in a relational database system. We can then mark this class as an Entity and connect it to the real database schema based on the table’s name as well, which is stored in this name node for example.
We can also add information from other data sources to this Java software structures like bugs from static code analyzers, the number of changes from the version control system or usage data that we’ve collected from our production system. This allows us to inspect our code from different angles as well. We have gazillions of information items and measures at hand at very fine-granular bases which are good for detailed analyses. But we need also means to summarize our possible findings to some higher-level concepts.
We can do this as well by adding that higher-level abstraction upon our code structures. For example, we could introduce a new node call “Pet” which represents a business subdomain – which means something a domain expert can understand – and assign code elements – like this class Pet here – to those higher-level abstractions and move to this higher level view as well.
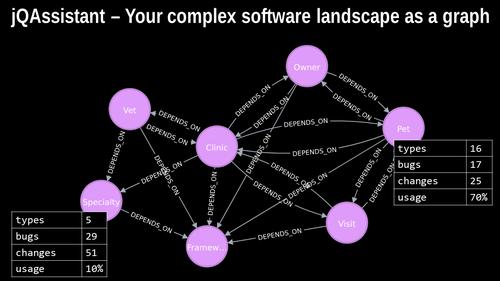
When we group the data to business subdomains, first, as a nice side effect, we get an overview of the inter-code relationships between the code elements because classes that are assigned to one subdomain could depend on classes from other subdomains which create a dependency between these subdomains as well. This is very helpful if you want to fix the dependencies between your modules by the way.
Second, we also can sum up all the underlying information items like types or measures like bugs, changes and usage data to get a per subdomain-based overview of our software system’s characteristics to something non-technical people can understand in the best case. And then we can discuss internal quality aspects of the software systems. For example, we see here that this module has more bugs than the other and was change very often which could be tempting for developers to fix this part of the software immediately. But a domain expert or product manager could intercede and say: “Don’t improve anything in this module. It was just an experiment and it was a failure. But we have many new requirements for the Pet module. Please invest some time in fixing the bugs here.”
With the graph-based approach, I believe that we can improve the dialog between developers and non-technical people like domain experts or even management.
Real-World Analysis
Let’s look at the kind of problems we can identify by using data analysis in software development. Here, a word of caution: With great power comes responsibility. I mean, we have now the means to look very detailed into our software systems and can create irrefutable analyses. This means that you could find things, which might not be good for others or even your careers. For others, judgment day might come, because you might find big design failures which could mean a huge amount of wasted money and additional costs to fix those failures. But also for you, if you analyze data like personal data or try to analyze the developers’ performance without consulting your staff council or your boss. So be warned!
But if you don’t choose the dark side of Software Analytics, you can identify problems like these:
- Show the impact of knowledge loss/developer turnover
- Identify unused, error-prone or abandoned code
- Create a pattern catalog for software systems
- Find unwanted dependencies between modules
- Spot performance bottlenecks by call tree analysis
In general, making specific problems in your software system visible! E. g. race conditions, architecture smells, build breaker, programming errors, dead code and so on.
There are also some showcases on my blog that you can have a look at:
- You can spot no-go areas in a big code base which means places in source code where none has gone in years and where the knowledge about the code is completely lost.
- You can take a look at how we can find code smells in our own code bases using graph database queries
- You also can read about how you can transform our findings into something that management can understand
If you want to read some books or dive right into the analysis part, here you find some good resources:
Literature
- Christian Bird, Tim Menzies, Thomas Zimmermann: The Art and Science of Analyzing Software Data
- Tim Menzies, Laurie Williams, Thomas Zimmermann: Perspectives on Data Science for Software Engineering
- Wes McKinney: Python For Data Analysis
- Adam Tornhill: Software Design X-Ray
Software
- My favorite Python Data Science Distribution: anaconda.com
- My project/tutorial on DataCamp
- Example project for graph-based, structural analysis with jQAssistant
- My GitHub-Repository
Summary
So, that’s what I’m doing here: Data Analysis in Software Development!
Please take away:
Tools are available!
- First steps are easy to do
-
Specific in-depth analysis is worthwhile
Visibility is possible!
- Build business’ perspectives on code
-
Problems in code can be communicated
Make an impact!
- Address severe risks based on actual data
-
Don’t fix symptoms, solve root-causes
For any questions or feedback, please comment on this blog post!